
Light we cannot see
Most of what Hubble photographs is visible light, the kind human eyes can detect. But the universe radiates energy across a much wider range of wavelengths, and some of the most scientifically valuable information is locked in ultraviolet light, just beyond the violet end of the visible spectrum.
The problem is that Earth's atmosphere absorbs ultraviolet almost completely before it reaches the ground. If you want to observe the universe in ultraviolet, you need to get above the atmosphere entirely. This is one of the core reasons Hubble exists.
What the Cosmic Origins Spectrograph does
One of Hubble's instruments, the Cosmic Origins Spectrograph (COS), is designed specifically to capture ultraviolet light from distant objects: quasars, hot young stars, and clouds of gas drifting between galaxies. Rather than taking a picture, COS acts more like a prism. It spreads incoming light out by wavelength into a spectrum, a kind of barcode that encodes information about what the source is made of, how hot it is, and how fast it is moving.
Each element on the periodic table absorbs and emits light at specific, known wavelengths. When astronomers see a dip in a spectrum at a particular wavelength, they know that element absorbed that light somewhere along the line of sight. By reading these barcodes, COS has helped map how ordinary matter is distributed throughout the cosmos, how galaxies exchange gas with their surroundings, and how the chemical elements were forged and spread over cosmic time.
COS was installed on Hubble in 2009 and has been collecting ultraviolet spectra ever since, building up one of the richest ultraviolet archives in existence.
Why calibration matters
A spectrum is only useful if you trust the numbers it gives you. When COS detects light, what it records is a count of photons hitting its detector: raw electrical signals that need to be converted into physical units of brightness, called flux. This conversion is called flux calibration, and it is what allows astronomers to say a particular gas cloud contains a specific abundance of carbon rather than just some carbon.
The calibration is performed by software called calcos, which applies a sensitivity curve to convert raw counts into flux. That curve is derived from repeated observations of white dwarf stars, whose ultraviolet brightness can be calculated from physics with high precision.
In practice, things drift. The detector has been slowly losing sensitivity since launch as radiation degrades the detector materials. The detector is also periodically shifted to a new physical position on its surface to prevent any one region from wearing out, and each new position has subtly different characteristics that require their own corrections.
There is also a more fundamental question: how do you know the calibration is right at all? If something has gone wrong, whether a bad observation, an uncorrected anomaly, or a detector effect that was not anticipated, you might not know unless you check against an independent source.
That is what this project is about.
Fifty years of ultraviolet data
COS is not the first instrument to observe the ultraviolet universe. Several other telescopes, some still operating and some long retired, observed many of the same targets over the past five decades, and their calibrated data are stored in a public archive called the Mikulski Archive for Space Telescopes. Each of these instruments made its own independent brightness measurements of the same stars and galaxies.
The Space Telescope Imaging Spectrograph (STIS) has been on Hubble since 1997 and shares the same telescope optics as COS, making it the most direct comparison available. If COS and STIS measure the same source and get the same answer, that is strong evidence the calibration is working.
The Faint Object Spectrograph (FOS) and the Goddard High Resolution Spectrograph (GHRS) were Hubble's original ultraviolet spectrographs, operating from 1990 to 1997. They predate upgrades made to Hubble during its first servicing mission and operate on an older calibration baseline, so some difference from COS is expected, but they still provide a useful cross-check.
The Far Ultraviolet Spectroscopic Explorer (FUSE) was an independent satellite that operated from 1999 to 2007, observing at even shorter ultraviolet wavelengths than COS can reach.
The International Ultraviolet Explorer (IUE) ran from 1978 to 1996, spanning nearly two decades, and accumulated an enormous archive of ultraviolet brightness measurements. Its spectral resolution is coarser than modern instruments, but its sheer longevity makes it invaluable for spotting sources whose brightness has genuinely changed over decades.
Any object that appears in both the COS archive and one of these older archives is a potential calibration test. If the two measurements agree, confidence in the calibration increases. If they disagree, that disagreement is a signal worth investigating.
What I built
My work at the Space Telescope Science Institute, supervised by Dr. Sten Hasselquist, focused on building a Python pipeline to systematically run this cross-check at scale: not just for a handful of hand-picked targets, but for every COS target with archival overlap across all five comparison instruments.
The pipeline works in five stages.
Finding the targets. The pipeline starts with a list of COS target names. Each name is queried against the Mikulski Archive for Space Telescopes, which resolves it to a position on the sky and returns all available observations.
Searching the archive. For each target, the pipeline queries for matching observations from STIS, FOS, GHRS, FUSE, and IUE. Only calibrated, science-grade spectral data products are retained.
Downloading and loading the data. Matched files are downloaded and cached locally. Each instrument stores its data in a slightly different format, so the pipeline handles each specifically. Before accepting any file, the pipeline checks the header to confirm it actually contains data for the intended target, filtering out cases where the archive returns observations of nearby or similarly named objects.
Putting everything on the same scale. Different instruments have different spectral resolutions. To compare them fairly, all spectra are binned onto a common wavelength grid, with bin widths set adaptively so lower-resolution instruments get wider bins while higher-resolution instruments retain more detail. Obvious bad data, including negative flux values, saturated pixels, and non-finite numbers, are removed before binning.
Producing the diagnostics. For each target, the pipeline generates a multi-panel plot. The top panel shows the brightness measured by every available instrument plotted together. The panel below shows the fractional difference between each comparison instrument and COS:
ratio = (comparison minus COS) divided by COS
If this number is near zero, the instruments agree. If it is consistently positive or negative, one instrument is systematically reading higher or lower than the other. The pipeline also masks the region above 1900 Angstroms for COS's G140L grating, which produces unreliable data there due to contamination from overlapping light orders.
What I found
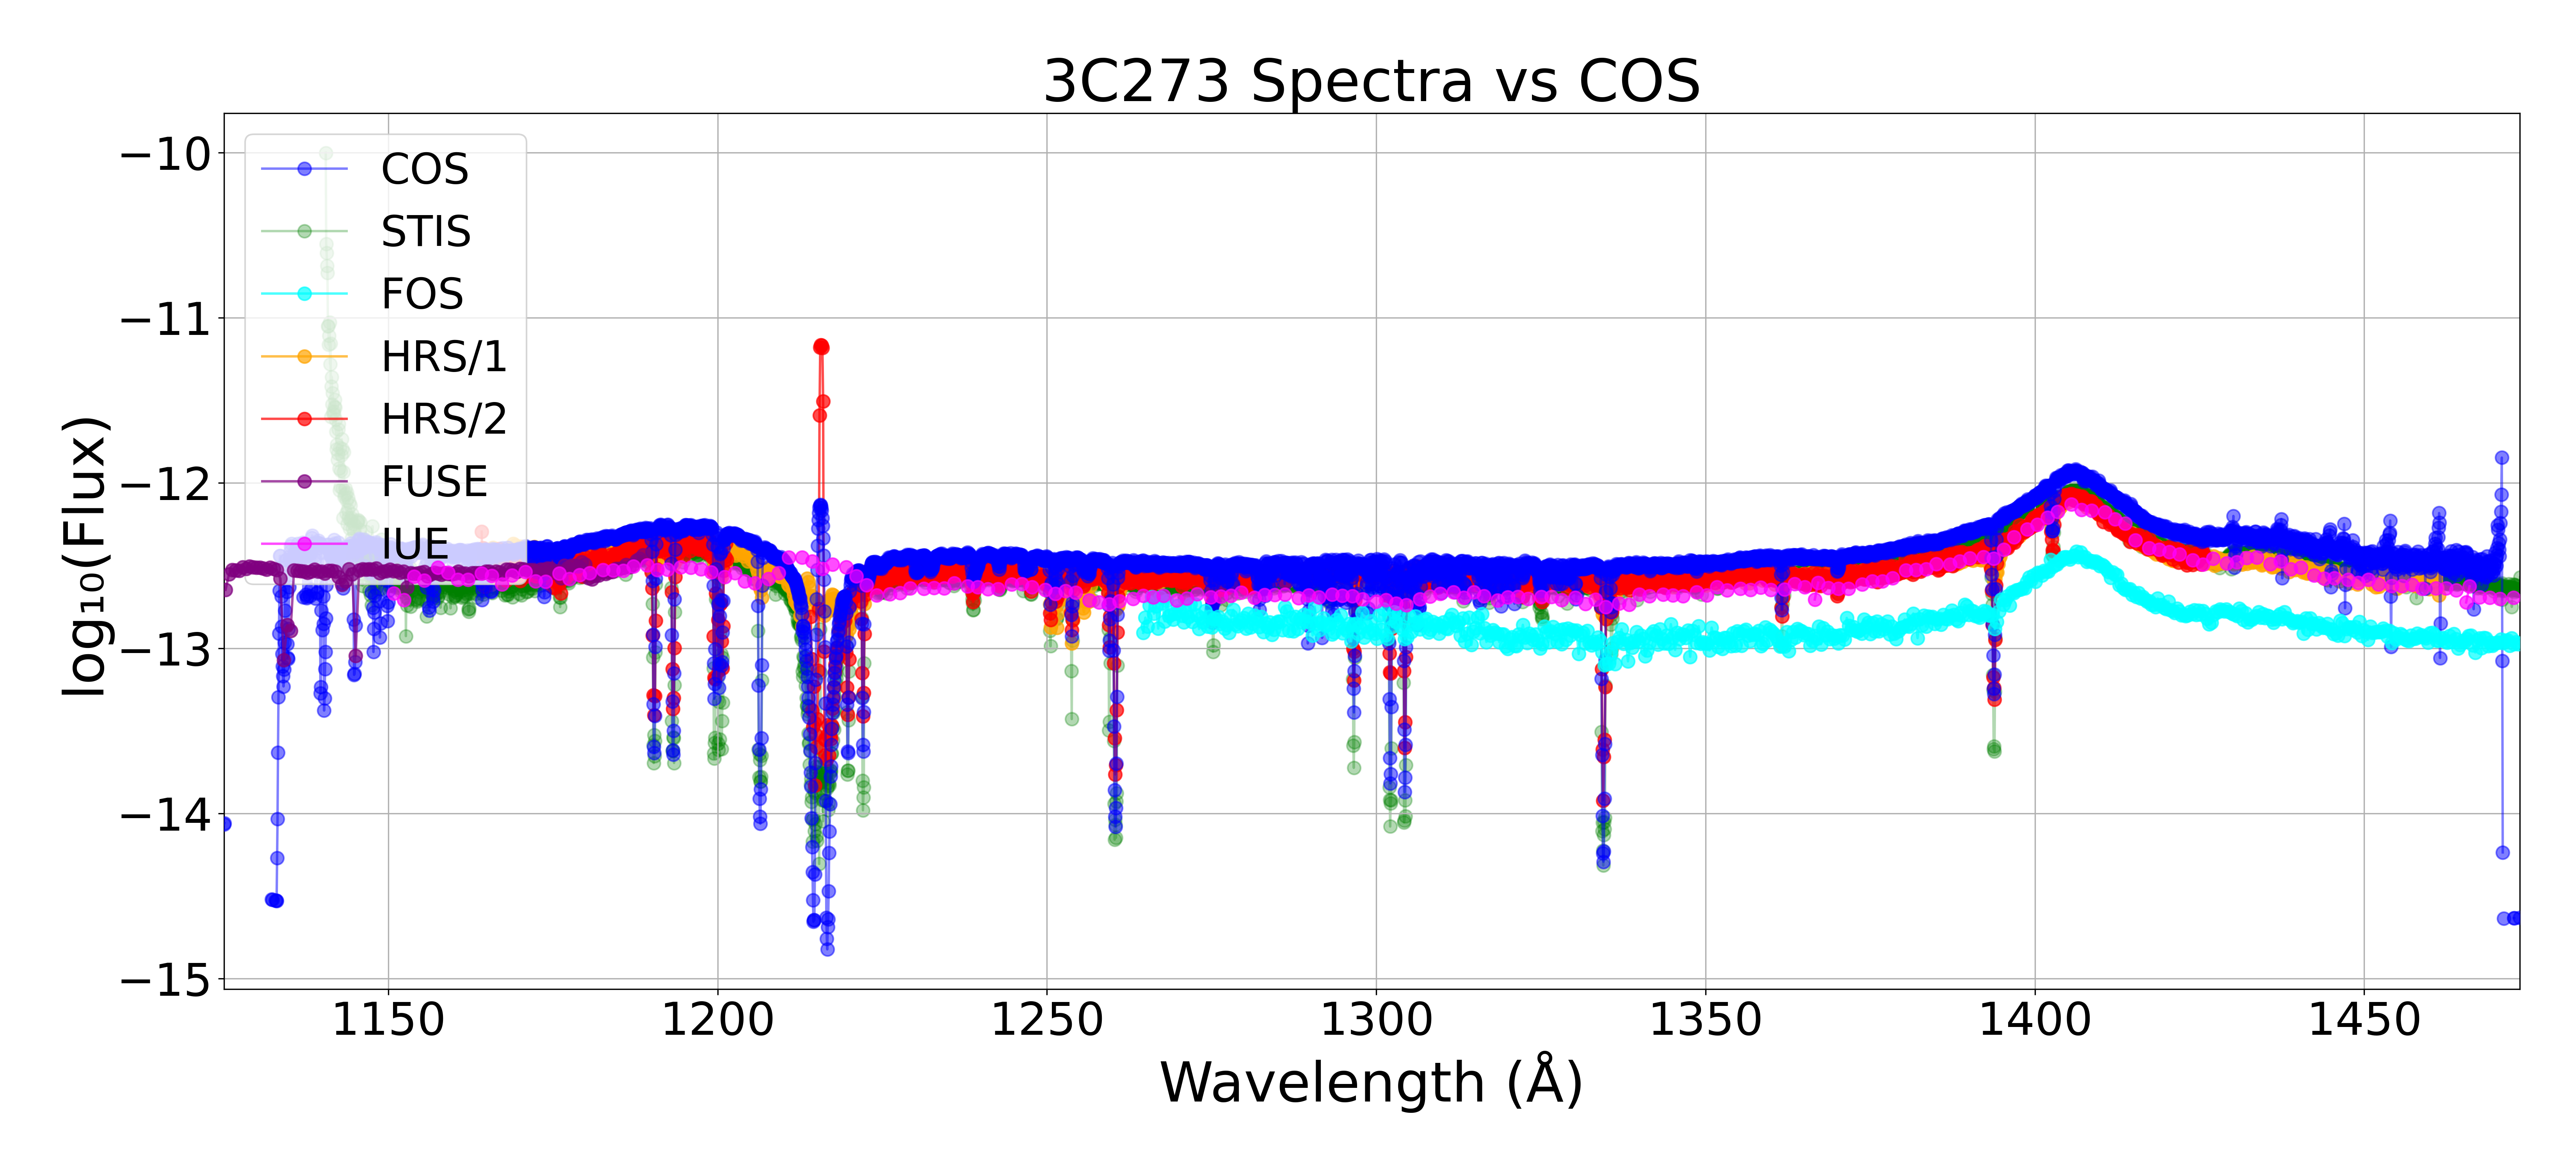
3C273: A Textbook Well-Behaved Target
The quasar 3C273 is among the best-behaved targets in the sample. It has been observed by all five comparison instruments, and the brightness measurements agree closely across the ultraviolet wavelength range, exactly what you would expect for a source that is not significantly variable and has been well-characterized over decades. Results like this provided an early confirmation that the pipeline was working correctly.
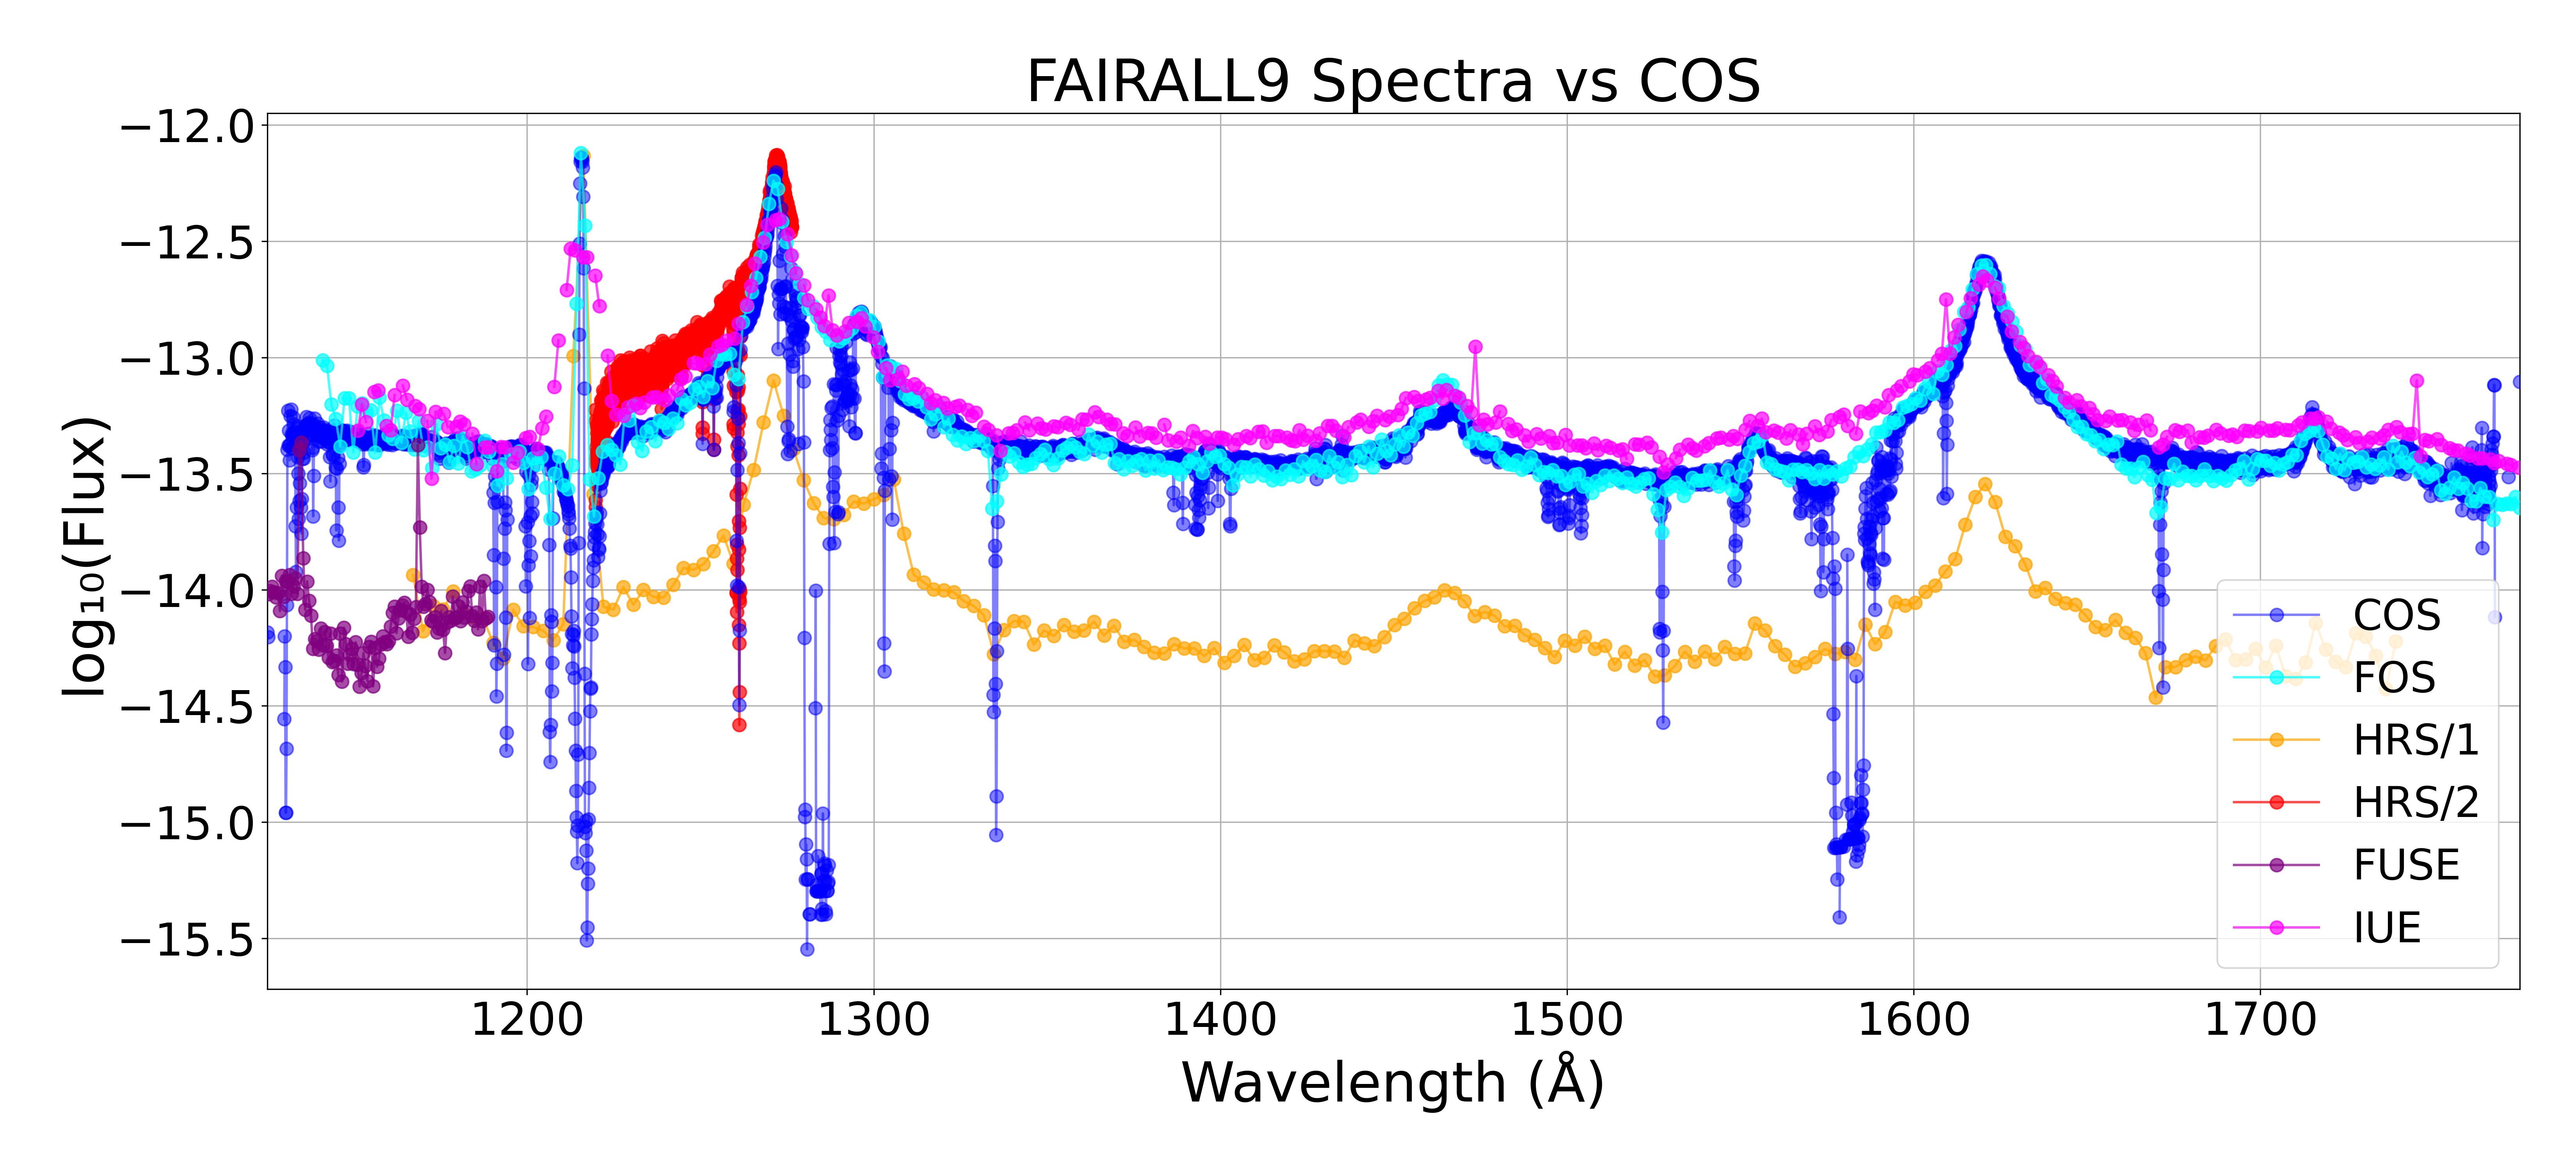
FAIRALL9: When the Source Itself Is the Culprit
FAIRALL9, a galaxy with a very active black hole at its center, tells a different story. The brightness measurements from different instruments diverge substantially, but the most likely explanation is not a calibration error. Active galactic nuclei are genuinely variable: the black hole's accretion rate changes over time, and so does the brightness. Because the observations span multiple decades, what looks like a calibration discrepancy is probably the source actually getting brighter or dimmer over time. The pipeline surfaces these cases so they can be investigated rather than averaged over.
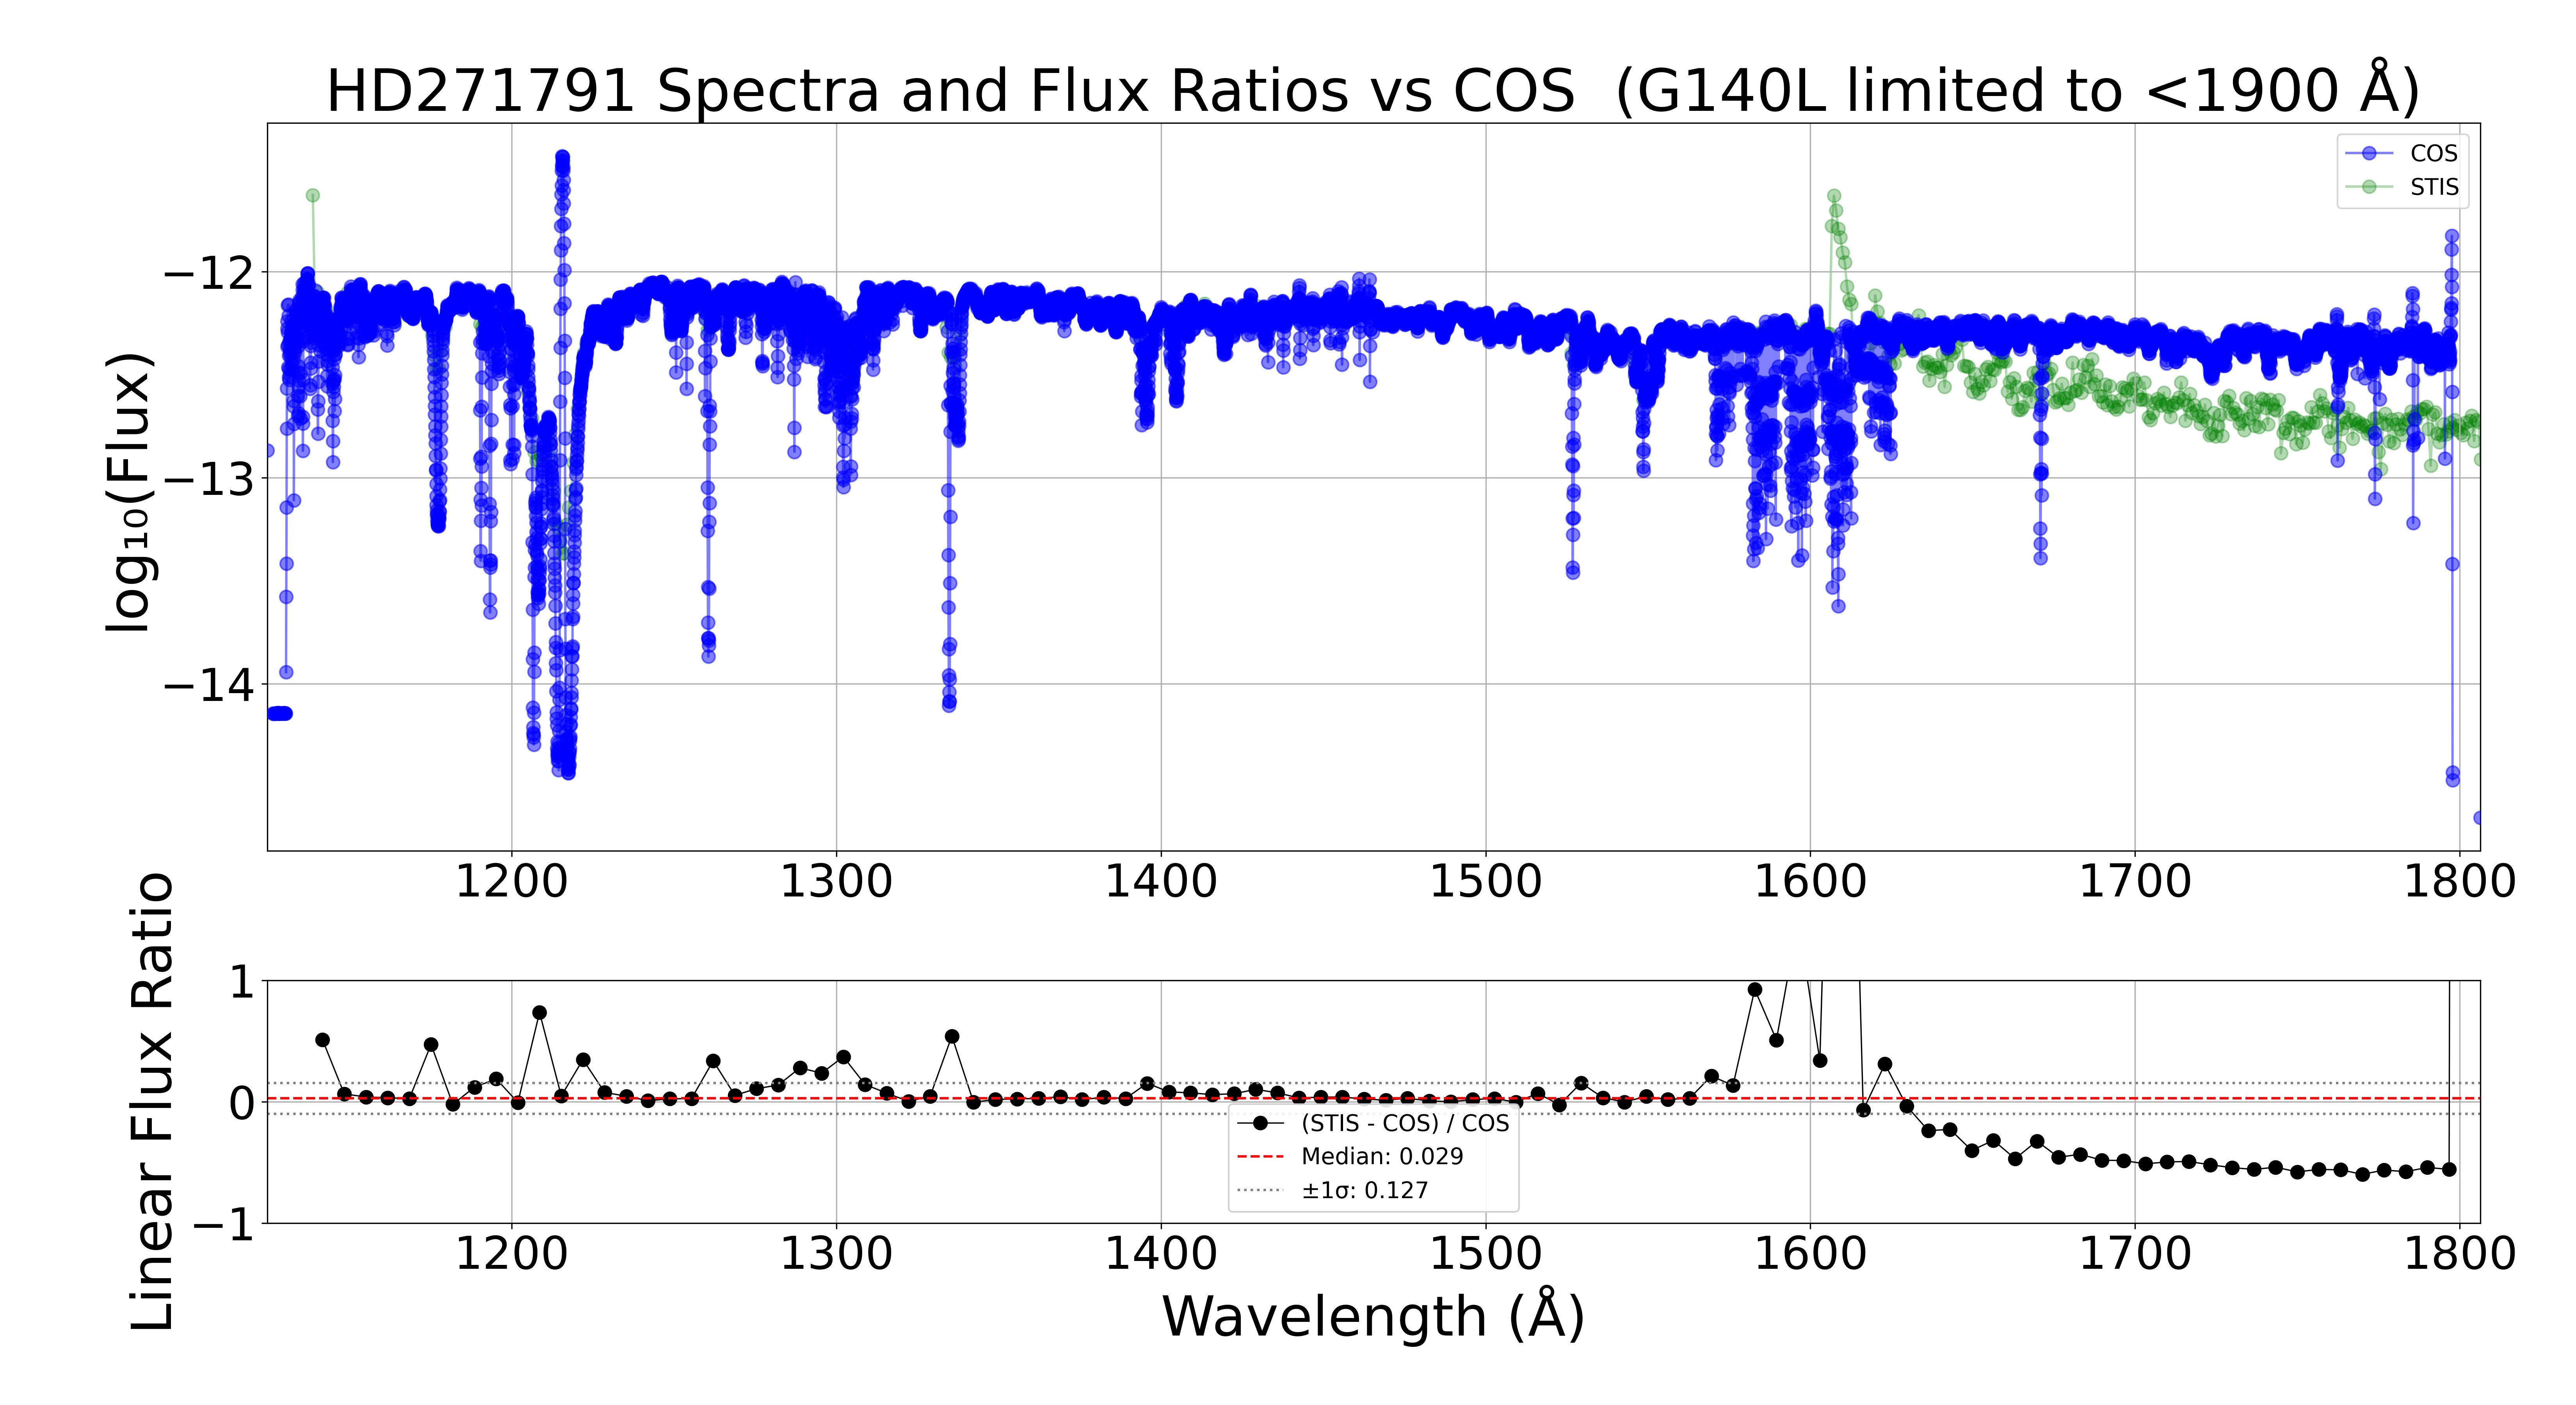
HD271791: A Clean Star Revealing a Known Grating Limitation
HD271791, a blue supergiant star, is observed with COS's G140L grating. Between 1200 and roughly 1600 Angstroms, COS and STIS agree well: the median flux ratio is +2.9% with a scatter of 12.7%, which is strong agreement given that these are independent instruments on different calibration timelines. Above about 1600 Angstroms, however, the agreement breaks down noticeably. This is not a surprise: the G140L grating is known to suffer from second-order light contamination at longer wavelengths, where light from two different diffraction orders overlaps on the detector and corrupts the flux measurement. The pipeline masks this region for G140L data, and the plot clearly shows where the divergence begins.
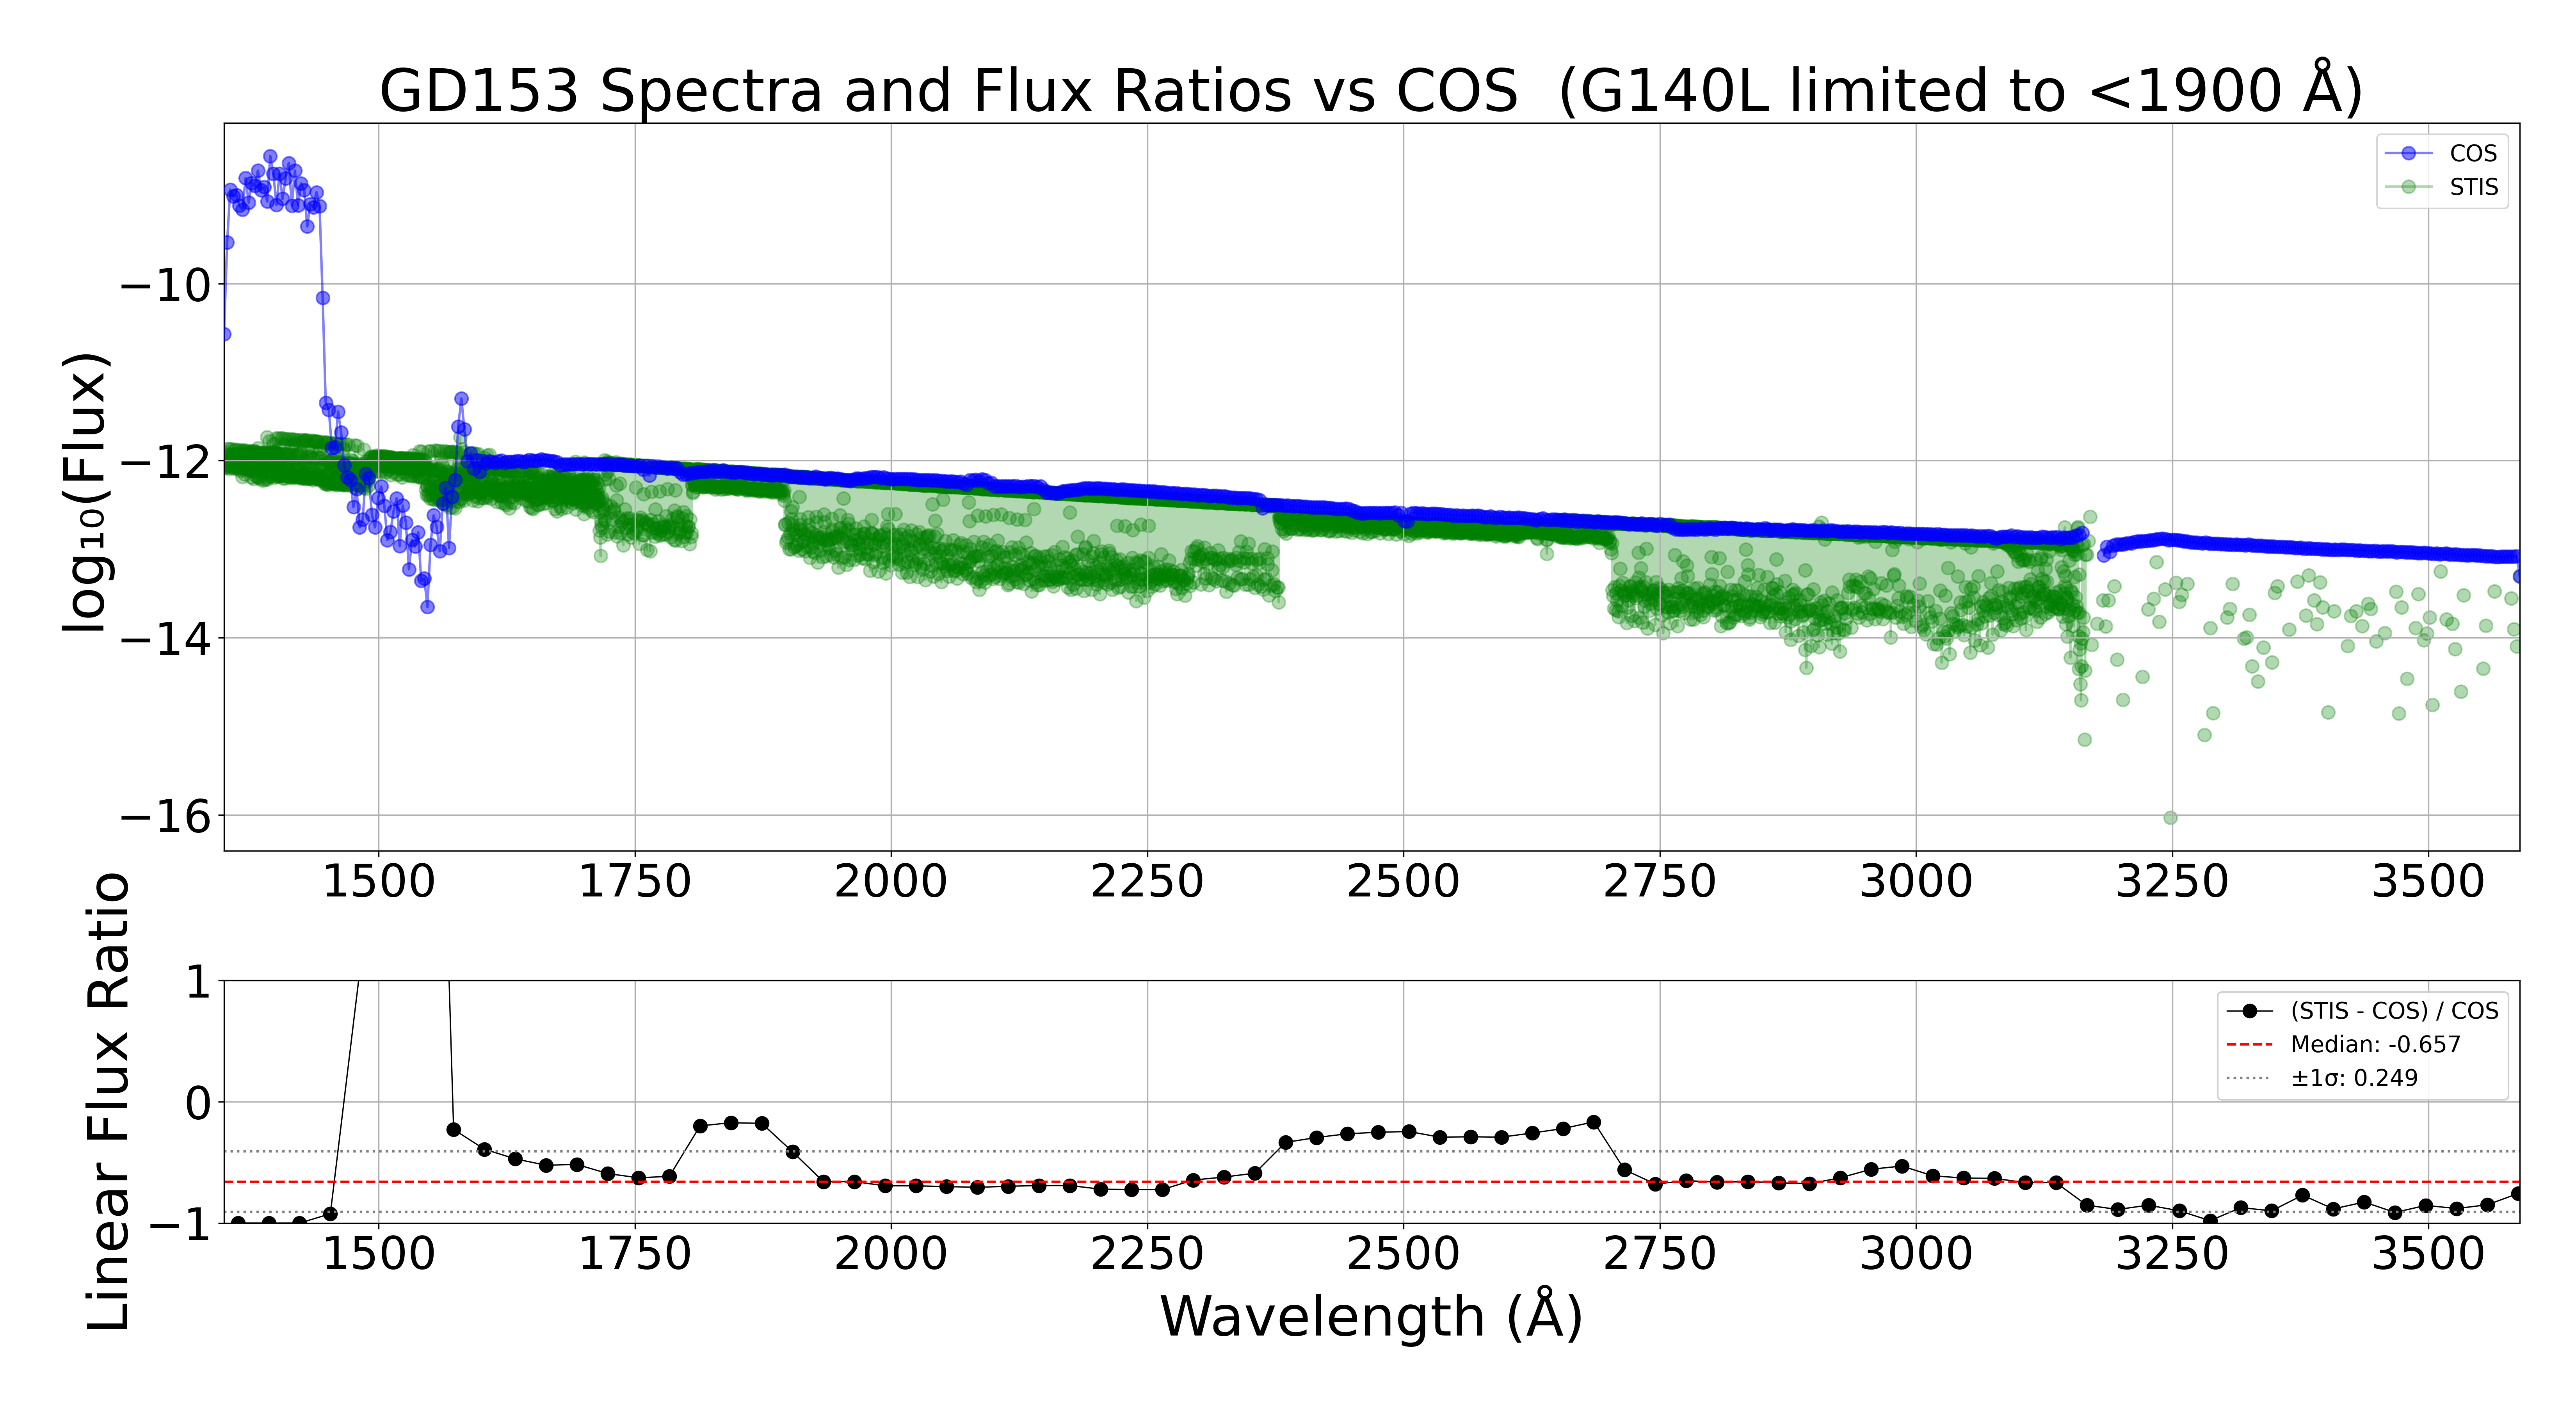
GD153: A Miscalibration That Turned Out to Be a Bad Observation
GD153 is a white dwarf star and one of the standard calibration targets Hubble uses to set its flux scale. Finding it as an outlier in the comparison was initially concerning. The STIS measurement comes in 65.7% lower than what COS records, a massive discrepancy that would be alarming if it reflected a true calibration error.
Investigation revealed the culprit: the STIS observation of GD153 had a signal-to-noise ratio of only 5.6, meaning the detector barely collected enough photons to produce a reliable measurement. The apparent offset is not a calibration problem; it is a noisy observation that looks like one. This is exactly the kind of case the pipeline is designed to flag, so that it can be investigated and set aside rather than pulling the statistics off-center.
The bigger picture
Across all targets, STIS agrees with COS to within about half a percent on average, with a scatter of roughly 12% across individual targets, which is strong agreement for two instruments sharing the same telescope. The Faint Object Spectrograph and Goddard High Resolution Spectrograph show larger systematic offsets of around -6% to -15%, which is expected given their older calibration baseline. IUE and FUSE fall in between, with offsets of -5% to -8%.
As an internal check, the pipeline also compared COS observations of the same target taken at different times. Across 301 targets observed in three or more visits, COS's own measurements agreed with each other to within about 1.5%, establishing a baseline for how much scatter is irreducible measurement noise versus a real signal worth investigating.
The best cross-instrument consistency is found between 1300 and 1900 Angstroms, the core of COS's operating range. Agreement degrades at the shortest ultraviolet wavelengths and above about 2000 Angstroms, partly due to the G140L grating contamination described above.
Where the project is headed
The work is ongoing. The next phase will incorporate targets from the Hubble Spectroscopic Legacy Archive, a unified database that combines COS and STIS spectra across multiple visits and programs into co-added spectral products. The broader target coverage and improved signal-to-noise from co-adding will allow the pipeline to run comparisons on a significantly larger sample, tightening the statistical constraints on any systematic offsets and surfacing calibration trends not yet visible in the current dataset.
The broader goal remains the same: ensuring that when a researcher retrieves a COS spectrum from the archive to measure the composition of gas around a black hole, or to trace the chemical evolution of a distant galaxy, the flux scale it carries has been independently verified and can be trusted. That is what calibration work is for, and there is more of it left to do.